Confusion Matrix VIP Exclusive
🗺️ What is this?
In classification tasks, the confusion matrix is a detailed "error notebook".
It not only tells you the model's score, but also clearly lists: which questions were answered correctly, which were answered incorrectly, and how they were answered incorrectly.
🧐 How to read?
The rows and columns of the matrix represent:
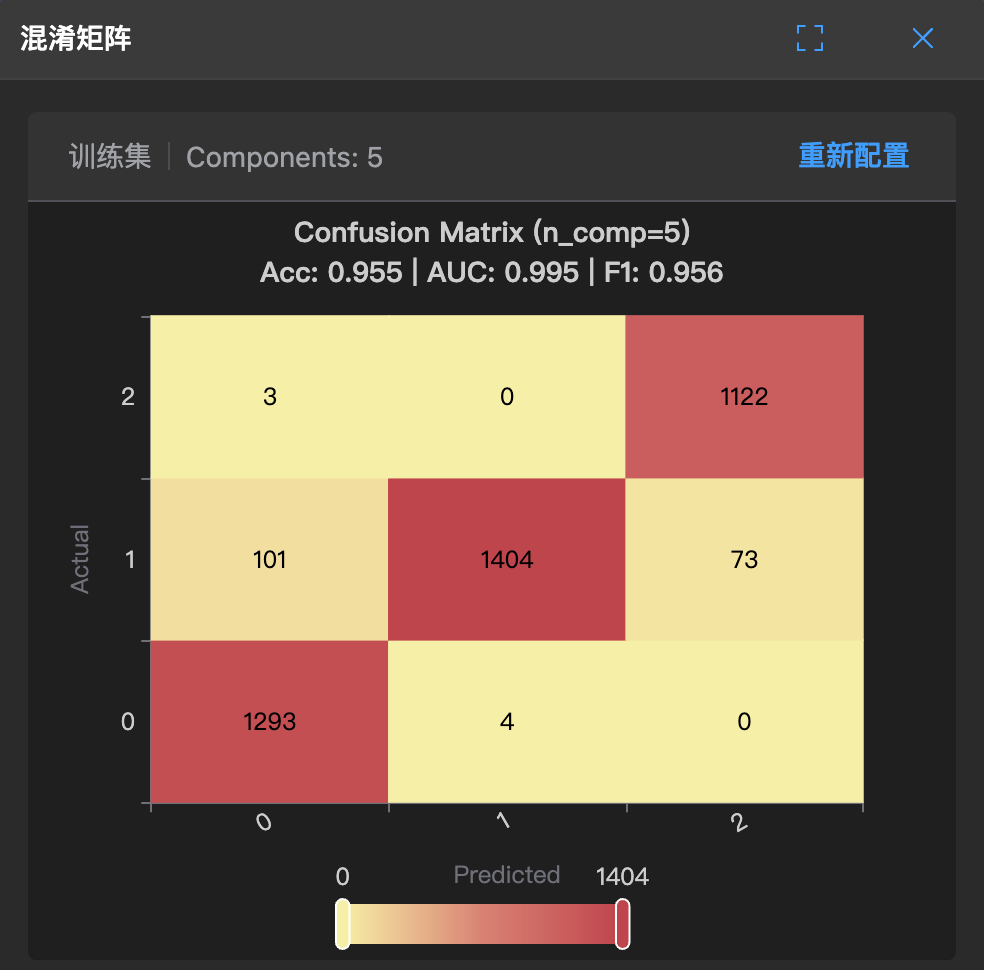
- Actual: The true class of the data (vertical direction, e.g., 0, 1, 2).
- Predicted: The predicted class given by the model (horizontal direction, e.g., 0, 1, 2).
1. Find the diagonal (correct answers)
- The diagonal from top-left to bottom-right represents the number of correct predictions.
- For example, in the figure, there are 1293 samples that are actually 0 and predicted as 0; there are 1404 samples that are actually 1 and predicted as 1. These cells are usually darker (according to heatmap colors), and larger numbers are better.
2. Check non-diagonal (incorrect answers)
- Cells outside the diagonal are where the model makes mistakes.
- For example, in the figure, there are 3 samples that are actually 2 (possibly defective products) but predicted as 0; there are 73 samples that are actually 1 but predicted as 2.
- You can discover the model's "weaknesses" through these cells: Is it particularly prone to misclassifying one class as another?
3. Check top indicators (Acc / AUC / F1)
The chart provides three core indicators at the top:
- Acc (Accuracy): Overall correct answer ratio (0.955).
- AUC: Overall discrimination ability (0.995).
- F1: A score that balances precision and recall (0.956).
🛠️ When to use?
- When you find the model's accuracy is high but still feel "something is wrong".
- Especially when business costs differ: For example, the cost of misclassifying "defective products" as "qualified products" is much greater than misclassifying "qualified products" as "defective products". Through the confusion matrix, you can clearly see how many times such "fatal errors" occur.