Anomaly Detective: T² & SPE
🕵️♂️ What are T² and SPE?
These are two "monitors" specifically responsible for catching "bad apples" in the data.
Hotelling's T² (Internal Model Anomaly):
- Imagine an ellipsoidal room (model space) where normal data plays.
- T² anomaly: Points that run to the corners or even outside the wall. Although they are still within the model rules, they are isolated and strange.
SPE (DModX) (External Model Anomaly):
- Still that room, SPE measures the height of the point from the floor (residual).
- SPE anomaly: Points floating in the air that completely violate the model rules, like ghosts.
📊 How to read?
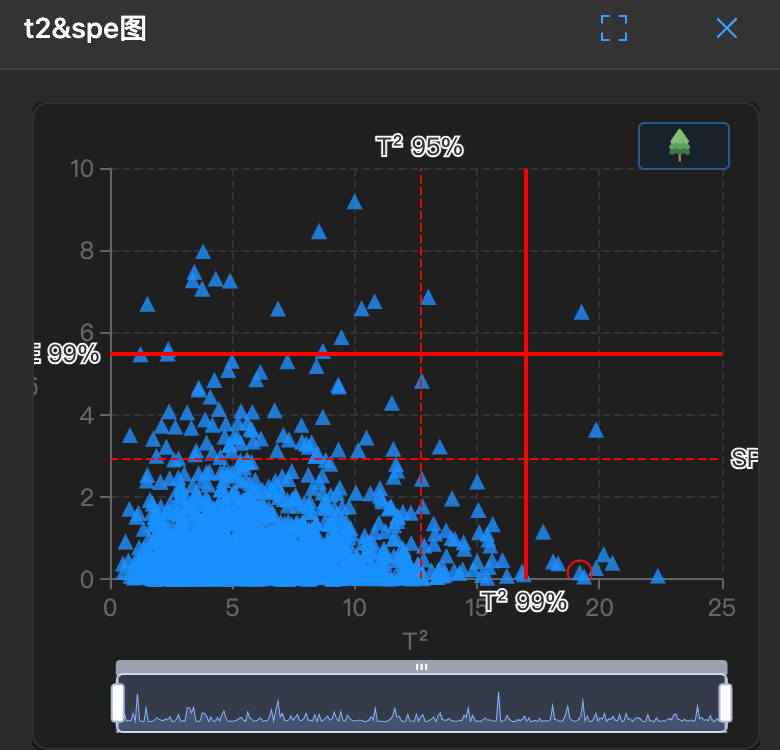
Open the T² & SPE chart, and you will see:
- Red Line (Limit): This is the warning line (95% or 99% confidence limit).
- Points: Each point represents a sample.
- Any point exceeding the red line is a suspect! 🚨
- If points are in the top-right corner (both T² and SPE exceed limits), they are serious criminals and must be prioritized!
🛠️ How to use?
- Quick location: Directly look at points outside the red line.
- Lasso capture: Use the mouse to circle them.
- View details: After selection, you can go to the "Data Removal" interface to see who they are (e.g., which row, what time the data is).