Attribute Distribution Analysis
📊 What is this?
Imagine you're queuing at the supermarket checkout. Some people buy a lot, some buy a little. Distribution analysis counts how many people have different amounts.
It groups all data samples by value size to see where there are many and where there are few.
🧐 How to read?
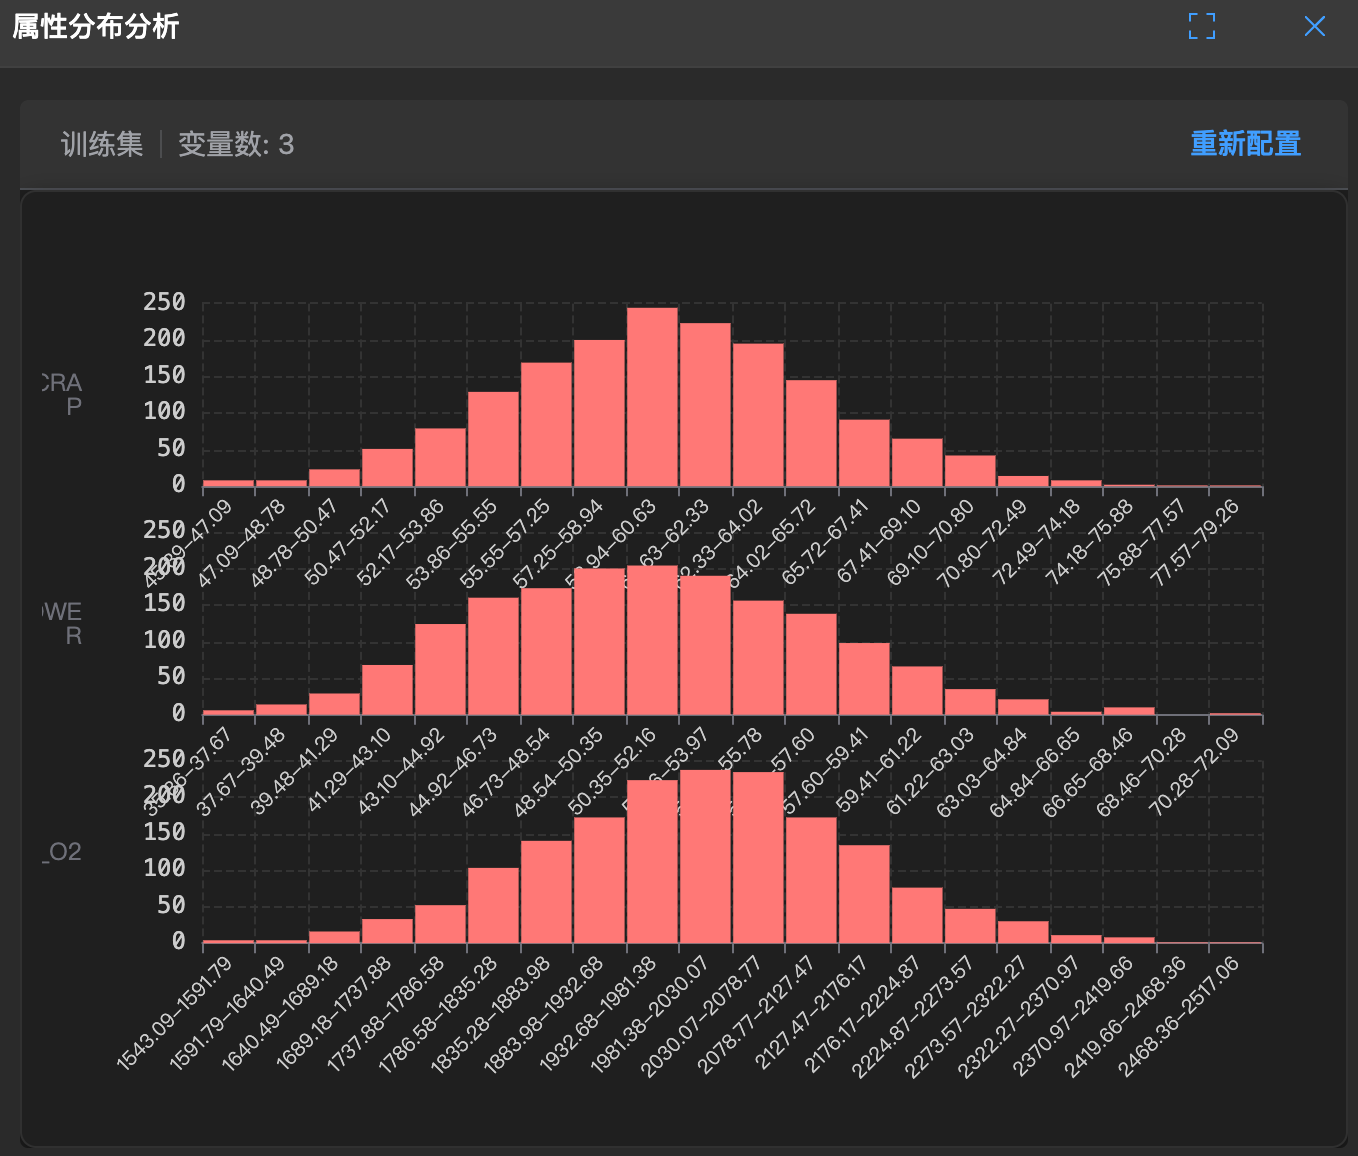
- Column height: Represents how many samples are in that value range. The taller the column, the more frequent that value appears.
- Shape:
- Bell-shaped (high in the middle, low on both sides): Standard normal distribution, which is good.
- Skewed: Indicates the data is biased (e.g., most people are poor, only Jack Ma is very rich).
- Bimodal (two peaks): Possibly two completely different groups mixed together (e.g., day and night temperatures).
🛠️ How to use?
- Check average level: The tallest column represents the average level of everyone.
- Catch outliers: If there's a short column alone on the far right or left, it might be an outlier.