Model Summary
📊 What is this?
This is the health check report for PLS models. It tells you in the simplest way whether your model is healthy or not.
It displays the core indicators of the model across different dimensions.
🧐 How to read?
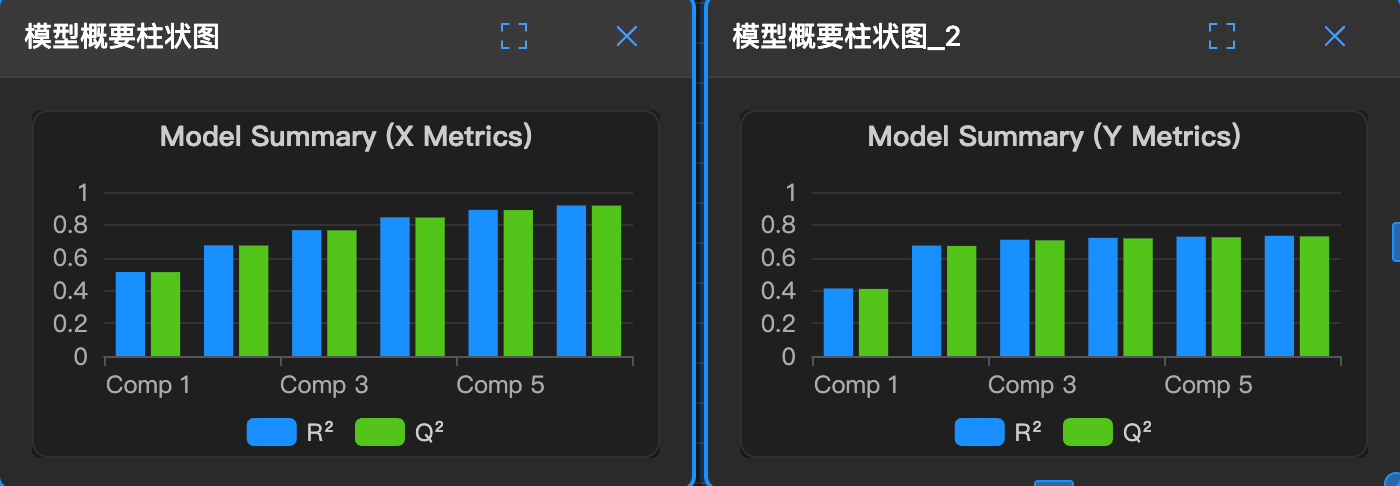
- R² (Explanatory Power): Like a student's exam score. Higher is better, with a perfect score of 1.0. If > 0.8, the model is excellent!
- Q² (Predictive Power): Like a student's application problem score. Higher is better. If R² is high but Q² is low, it's memorizing without understanding (overfitting).
- RMSE (Error): Like the number of wrong answers. Lower is better.
🛠️ How to use?
- Quick assessment: If you're unsure whether the model is good, look at this chart first. If everything is red (low scores), you need to adjust parameters again.
- Monitor progress: Each time you add a component (C+1), check if R² and Q² increase. Stop when they stop increasing.