Loading Plot VIP Exclusive
🕸️ What is this?
Score plots look at samples (rows), while loading plots look at variables (columns).
It tells you: Who is the mastermind? Who is in which group?
🧐 How to read?
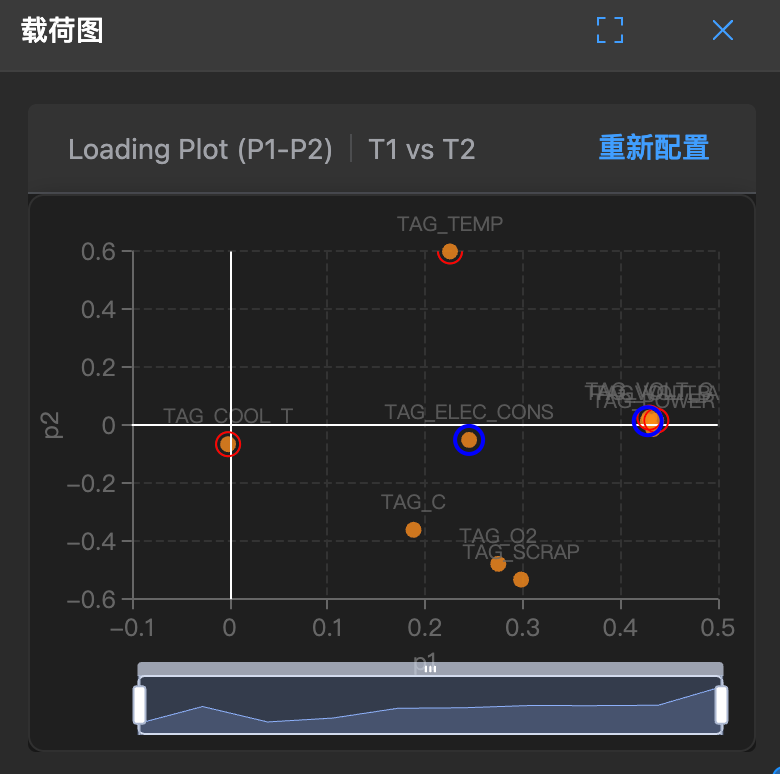
- Distance:
- Points farther from the origin (0,0) have a greater impact on the model.
- Variables clustered in the center are basically irrelevant.
- Angle:
- Positive correlation: Two points very close to each other (small angle), indicating they always move together (e.g., when pressure increases, temperature also increases).
- Negative correlation: Two points opposite each other across the origin (180° angle), indicating they are enemies (e.g., when yield increases, purity decreases).
- No correlation: Two points form a right angle (90°), indicating they don't interfere with each other.
🛠️ How to use?
Note: This chart has a lasso function for selecting abnormal parameters.
- Find key factors: Look at the point farthest from the origin - it's the culprit causing process fluctuations!
- Simplify variables: If two points overlap, it means they carry the same information. Maybe you only need to measure one in the future, saving costs!