T² & SPE Joint Distribution VIP Exclusive
🤝 What is this?
This is joint law enforcement. Both Captain T² and Captain SPE work together.
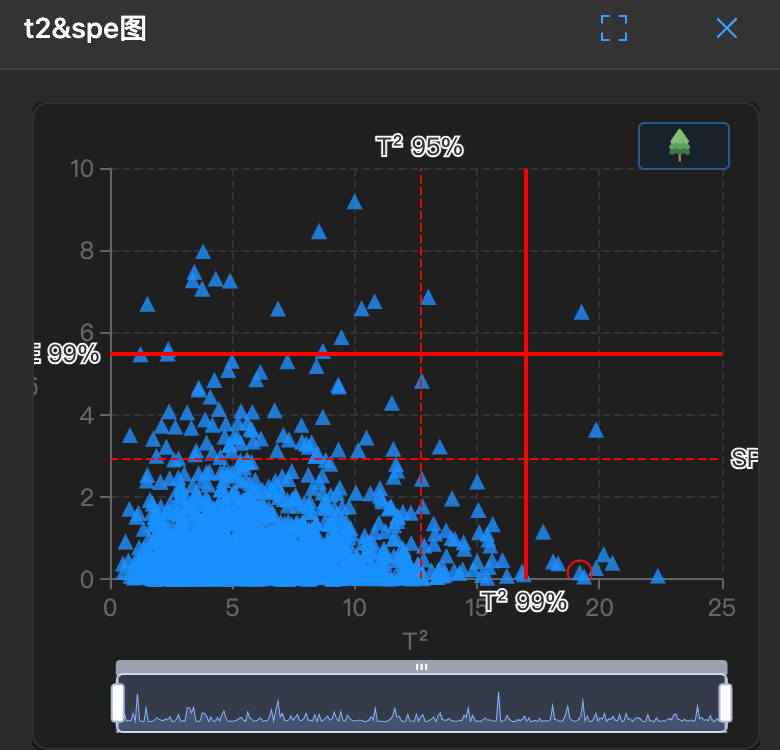
It places sample points' performance on T² and SPE on a scatter plot, allowing you to see the anomaly type at a glance.
🧐 How to read?
- Bottom left corner: Normal people, everyone gathers here.
- Bottom right (high T²): Strong outliers, internal model anomalies.
- Top left (high SPE): External model anomalies, ghost data.
- Top right (both high): Serious criminals, both extreme and strange.
🛠️ How to use?
Note: This chart has a lasso function for selecting abnormal parameters.
- Prioritize top right corner: These points are most suspicious, catch them first.
- Lasso capture: Directly use the mouse to circle the top right corner for batch removal.