Behind-the-Scenes Hero: VIP Contribution VIP Exclusive
🏆 What is VIP (Variable Importance)?
In PLS models, we want to know: Which variable has the greatest impact on the results?
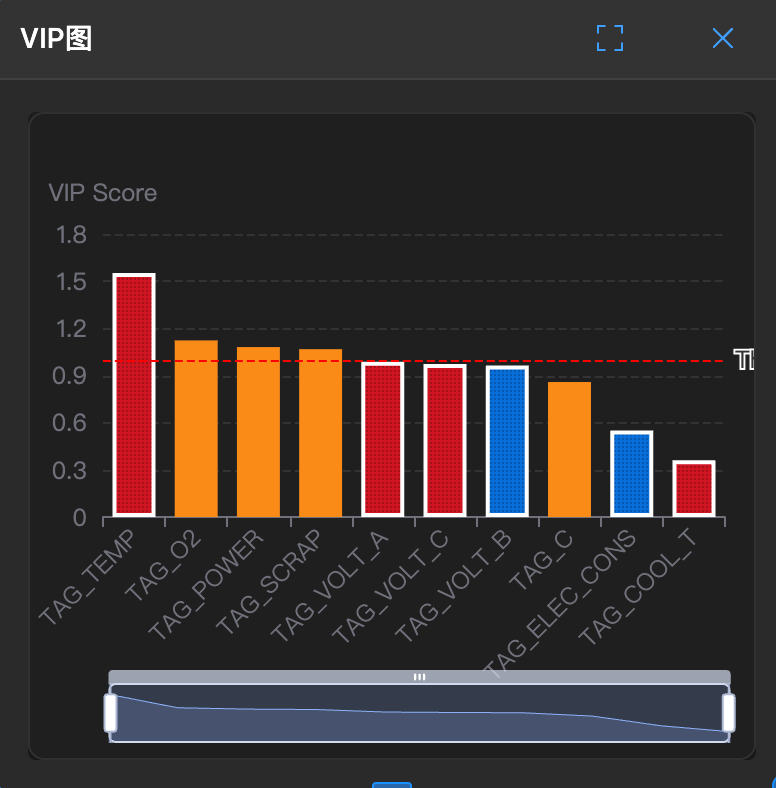
The VIP plot is a "contribution ranking chart".
📊 How to read?
Red Line (VIP = 1.0): This is a passing line.
- Good Variables: Above 1.0, indicating this variable is an important player and must be retained!
- Poor Variables: Below 0.4, indicating this variable is a background character and can be safely deleted.
Sorting: Columns are sorted from left to right by contribution from largest to smallest. The leftmost one is the leader.
💡 How to use?
Note: This chart has a lasso function for selecting abnormal parameters.
- Simplify the model: Delete all variables with very low VIP values. The model will be more accurate and compute faster!
- Find key control points: For example, if the variable with the highest VIP is "temperature", then you must closely monitor the temperature gauge during production.