ROC Curve
🗺️ What is this?
If you are doing classification tasks (discriminant models, such as judging product qualification/disqualification), the ROC curve is the "health check ECG" for the model's discrimination ability.
It shows the trade-off between the "probability of catching correctly" (True Positive Rate) and "probability of catching incorrectly" (False Positive Rate) under different strictness levels (thresholds).
🧐 How to read?
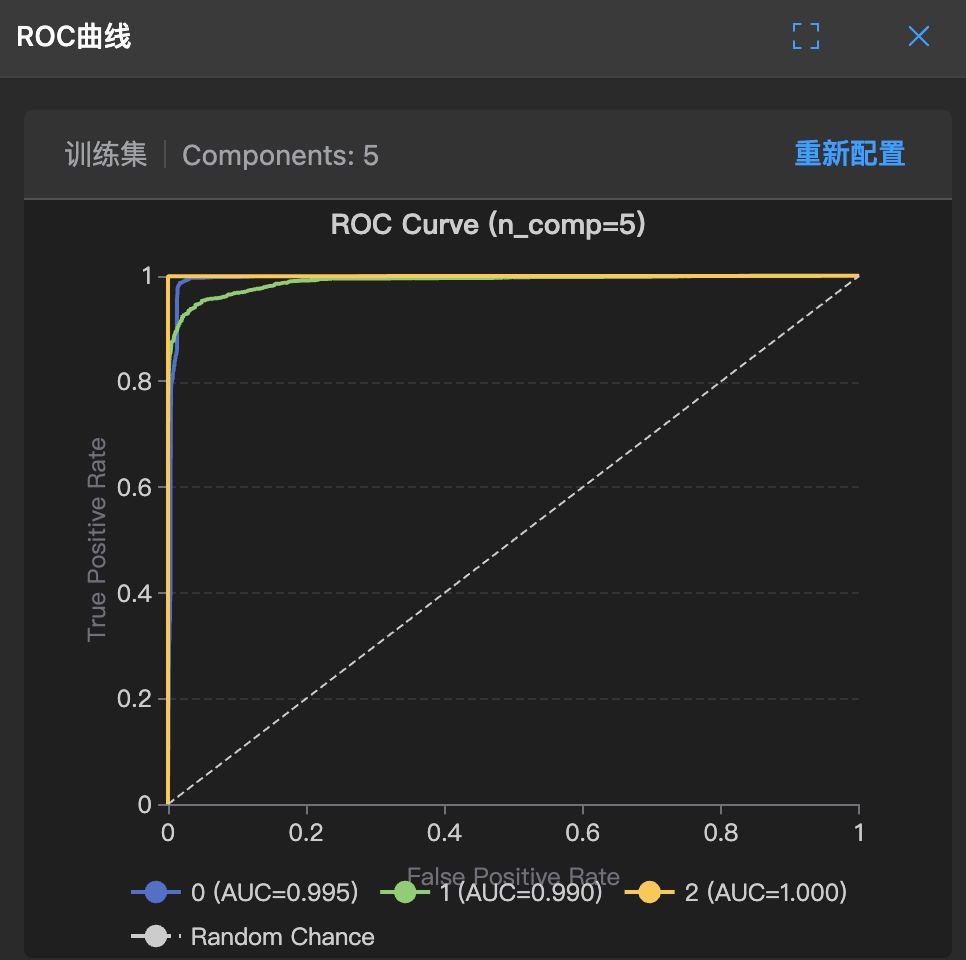
- Check the curve position:
- The closer the curve is to the top-left corner (i.e., the larger the area), the smarter the model is - it can catch correctly without easily accusing innocent people.
- If the curve is close to the middle dashed line (Random Chance), it indicates the model is basically "guessing" (like flipping a coin).
- Check the AUC value:
- AUC (Area Under Curve) is the area under the curve.
- AUC should be as close to 1 as possible. For example, in the figure, class 0 has AUC=0.995 and class 2 has AUC=1.000, indicating the model has extremely strong discrimination ability for these classes, almost perfect.
- Multi-class cases:
- There are different colored lines (0, 1, 2) in the figure, representing the model's recognition ability for each class. You can see at a glance which class the model is best at judging and which class it struggles with.
🛠️ When to use?
- When you want to evaluate the overall strength of a classification model, not just its accuracy under specific conditions.
- Especially in imbalanced classes (such as 5 defective products mixed in 1000 qualified products), looking at ROC curves and AUC is much more reliable than looking at accuracy alone!