X&Y Mantel Correlation VIP Exclusive
🔄 What is this?
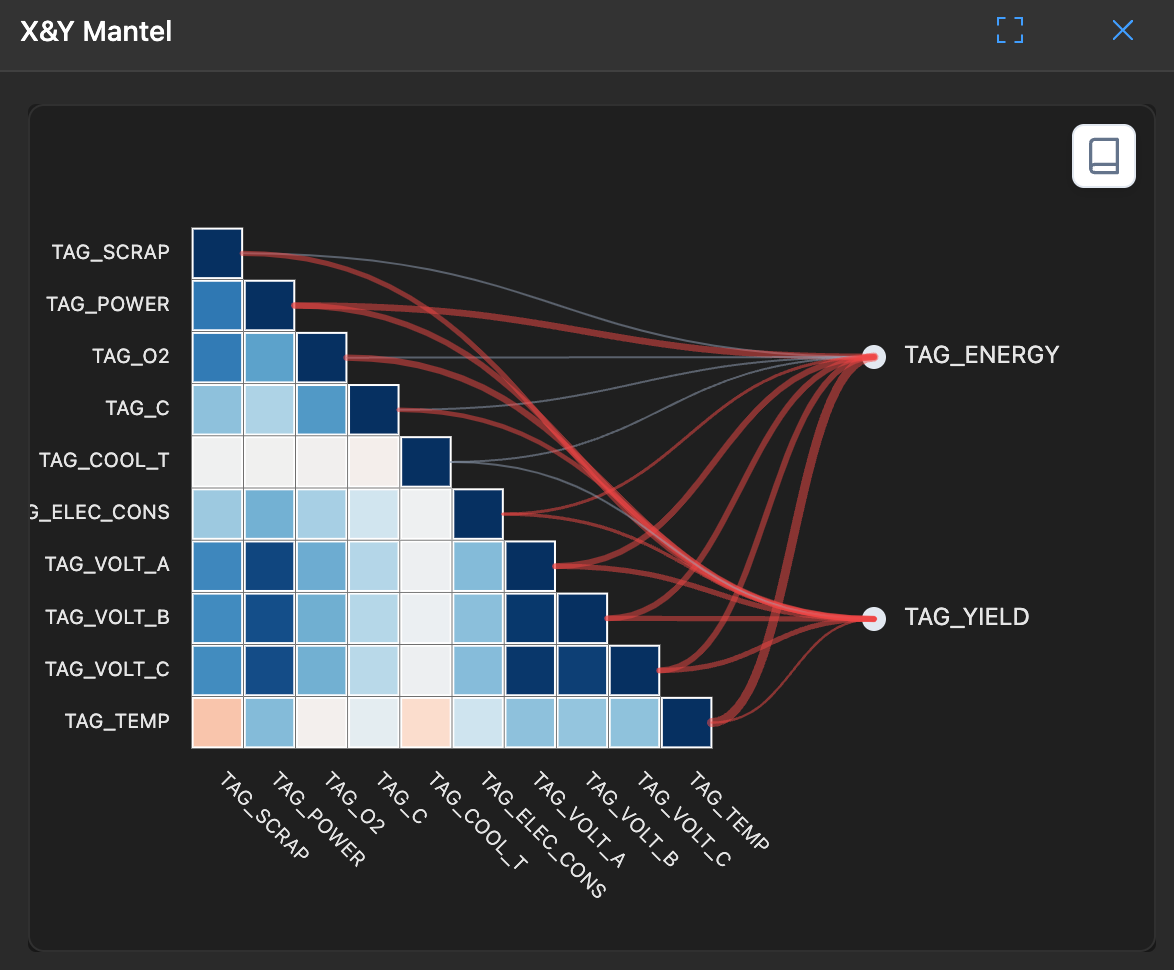
This is an advanced statistical chart mainly used to compare the overall similarity between two groups of variables (X and Y).
Imagine you have two classes (Class X and Class Y), and you want to know if there is an overall correlation between the students' grades in these two classes (e.g., if Class X performs well, does Class Y generally perform well too).
🧐 How to read?
- Scatter plot: Usually a scatter plot with the X-axis representing an indicator from group X and the Y-axis representing an indicator from group Y.
- Line: If there is a clear diagonal line, it indicates the two groups of variables are highly consistent.
- R value (Mantel r): This is a correlation coefficient. The closer to 1, the more the two groups of variables are like twins.
- P value (Significance): The smaller the better (usually < 0.05), indicating this relationship is not a coincidence but a real connection.
🛠️ How to use?
- Verify hypotheses: For example, if you want to prove that environmental factors (X) indeed affect biological communities (Y), Mantel test is the gold standard.
- Find correlations: If you're unsure whether these two groups of variables are related, run a Mantel test first.