Platform Introduction
Welcome to StarWay Data Insight (StarWayDI)! 👋
This is not just a boring statistical software, but an AI data exploration partner. To help you quickly understand the value of this platform, let's first clarify who can benefit from it and what core problems it can solve for you.
👨👩👧👦 Who Needs This Platform?
No matter what role you are, as long as you need to extract value from complex, multi-dimensional data, this platform can be your powerful assistant. Here are the core and extended user groups that the platform is most suitable for:
Core User Groups
- 👨🔬 Industrial Process / Production Technology Engineers
- Industries: Food, chemical, pharmaceutical, materials, fermentation, agricultural product processing, etc.
- Positions: Process engineers, production supervisors, process optimization specialists.
- Uses: Use PCA to observe batch differences and quickly locate abnormal production batches; use PLS to build regression models of "process parameters → product quality"; offline review of production data to optimize process formulas and accurately locate production problems.
- 🧪 Quality Control (QC/QA) Personnel
- Industries: Food, agricultural products, pharmaceuticals, fine chemicals, etc.
- Positions: Quality inspectors, quality supervisors, raw material acceptance personnel.
- Uses: Use PLS-DA for raw material grading, authenticity identification, and pass/fail judgment; use PCA to quickly find abnormal samples and analyze batch stability; efficiently process spectral data (such as near-infrared NIR) and physical-chemical indicators offline to achieve batch sample judgment.
- 🔬 R&D / Formula Engineers
- Industries: Food formulation, feed, daily chemicals, new materials, agricultural product breeding, etc.
- Positions: R&D personnel, formula engineers, breeding engineers.
- Uses: Use PLS to find key influencing factors of "composition/ratio → performance"; use PCA to reduce dimensionality and simplify multi-variable experimental data; through offline analysis of experimental data, significantly accelerate the R&D process of formulas and processes.
- 🧑🎓 Research Institutions & Testing Organizations
- Organizations: University laboratories, agricultural research institutes, analysis and testing centers, third-party testing institutions.
- Positions: Analytical chemistry researchers, laboratory technicians, data processing personnel.
- Uses: Process complex spectral, chromatographic, omics, and physical-chemical multi-variable data without writing code; easily complete tasks such as clustering, classification, and regression modeling, and quickly generate data analysis charts and reports that meet the standards for research projects or paper publication.
Extended User Groups
- 📊 Industrial Data Analysts: Specialize in processing factory offline historical data, conducting multi-variable comprehensive analysis of equipment status, product quality, and process flows (non-real-time online monitoring).
- 🔧 Equipment Operation and Maintenance Engineers: Offline analysis of equipment historical operation data, using PCA to mine potential fault features, and effectively distinguish between normal and abnormal working conditions.
- 🌱 Agriculture / Planting Technical Personnel: For example, analyze the complex relationship between soil composition, climate conditions, planting methods, and crop quality, and use PLS models to predict yield and quality.
🎯 What Can We Do?
Imagine you have a pile of messy experimental data or production logs, which contains gold but is also mixed with sand.
Our task is to help you "separate truth from falsehood":
- Eagle Eyes: Through statistical algorithms (PCA/PLS), you can see at a glance which data are "black sheep" (outliers).
- AI Brain: Built-in large language model (LLM) automatically diagnoses the business root causes of abnormal data and generates easy-to-understand cleaning suggestions and analysis reports.
- Future Prophet: Based on cleaned data, build prediction models to help you predict future trends.
💡 In simple terms:
Imagine you are developing a new dish in the kitchen (such as baking a cake). Your recipe includes flour, sugar, temperature, and time (these are your X feature variables), and you want to pursue the perfect taste and appearance (this is your Y target result).
In repeated attempts:
- Non-executable Area: Some recipes will burn the cake or the dough won't rise at all (abnormal data/out-of-bounds data). The platform will help you draw these "minefields" and tell you what you should absolutely not do.
- Finding the Optimal Solution: Among those recipes that can bake normal cakes (executable area), the platform can help you accurately find that "perfect ratio" among a bunch of complex parameter combinations, allowing you to easily replicate the best taste!
The key to making all this efficient lies in the platform's two core highlights - it breaks the threshold of traditional data analysis and makes complex operations simple and easy.
✨ Core Highlights
- Zero Code: No need to write a single line of Python code, just drag and click to complete complex analysis.
- Visualization: Say goodbye to cold number tables, all results are presented in interactive charts, click where there is a problem.
- AI Empowerment: Unique AI intelligent analysis and diagnosis function, not only tells you "where is abnormal", but also tells you "why it is abnormal" and "how to handle it" combined with your business scenario.
Now that you have mastered the core advantages of the platform, let's familiarize ourselves with its operation interface - the intuitive layout design allows you to quickly get started and efficiently carry out data analysis work.
🖥️ Interface Overview
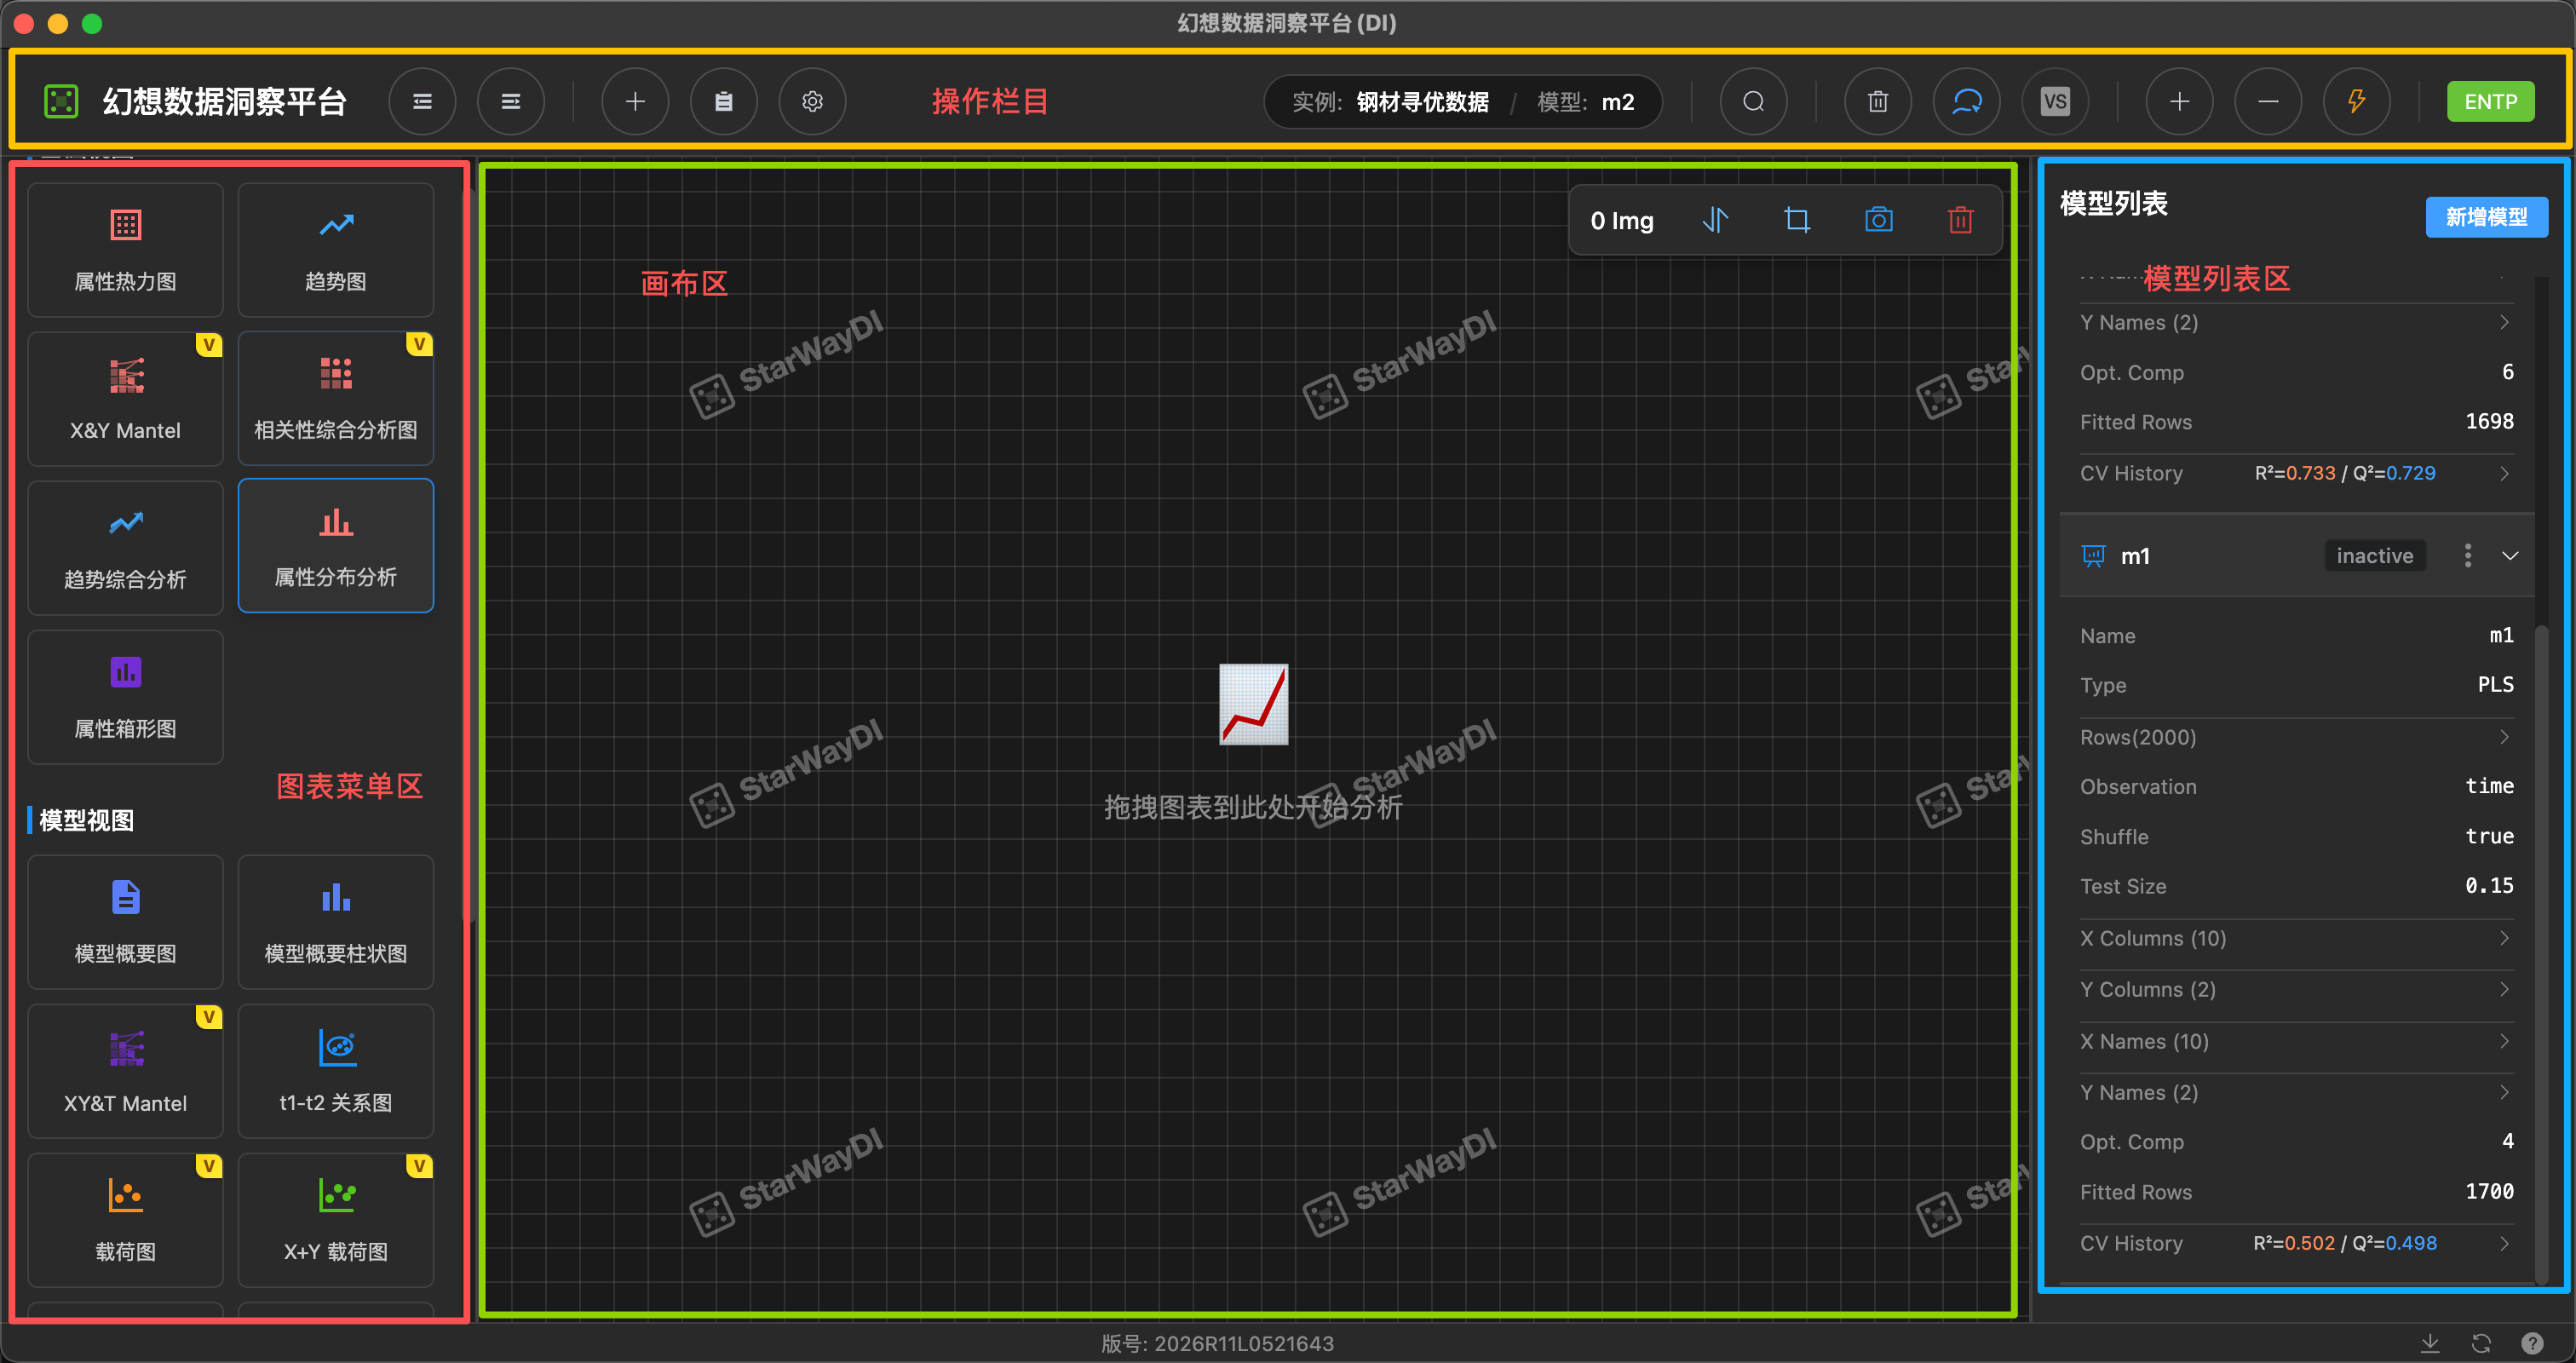
Our workbench is designed intuitively and divided into five main areas:
1. Top Bar
- Data & Models: Quickly switch between current business domains (such as "sales data") and analysis models (such as "m2").
- Instance Management: Includes operations such as adding instances, deleting instances, and switching instances.
- Common Tools: Includes shortcut buttons for data deletion, exploration, comparative analysis, model training, etc.
- Running Status: The green button on the right (such as ENTP) displays the current environment or license status.
2. Left Chart Menu Area
This is your "arsenal", containing all available analysis tools:
- Basic Views: Such as trend charts, heatmaps, box plots, etc., used for preliminary data exploration.
- Model Views: Such as loading plots, score plots, VIP contribution plots, etc., used for in-depth model diagnosis and noise analysis.
- Operation Method: Simply drag the chart to the central canvas with the mouse to use it.
3. Central Canvas Area
This is your main workbench:
- Free Layout: You can freely place, scale, and align various charts.
- Multi-dimensional Analysis: Supports viewing multiple charts simultaneously, facilitating comparative analysis.
4. Right Model List
Here manages all your model assets:
- Model Details: View the current model type (such as PCA, PLS, PLS-DA), number of samples, training parameters, etc.
- Performance Indicators: Intuitively display model goodness of fit (R²), prediction ability (Q²), AUC (only for classification models), F1 score (only for classification models), etc.
- Status Management: Switch the activation status of the model (Active/Inactive).
5. Bottom Status Bar
- Displays software copyright version number, system-related information, and provides operation documentation to ensure you always grasp the platform's running status, conveniently access operation guidelines, and ensure smooth analysis work.
🔍 Workflow
Data analysis on the StarWay Data Insight follows a clear, iterative process. From importing raw data to exporting cleaned results, each step is designed to make complex statistical analysis intuitive and efficient.
It is mainly divided into four steps:
- Data Preparation: Upload Excel, set who is the feature (X) and who is the target (Y).
- Modeling Analysis: Click Fit to train the model, the system automatically matches algorithms (PCA/PLS/PLS-DA) to initially establish variable relationships.
- Data Cleaning: This is the core! Discover outliers through charts, remove noise, retrain, and continuously improve model quality.
- Result Output: When model indicators (R², Q², AUC, F1 score) are satisfactory, export clean data and analysis reports.
The specific workflow is as follows:
Are you ready? Let's start this data exploration journey! 🚀