
AI Capabilities Overview
The StarWay Data Insight platform has built in an AI capability matrix designed for industrial data analysis scenarios. It is not "a chat box wrapped around the product", but rather embeds the large language model into the real modeling and cleaning workflow——the AI reads your model metrics, fetches chart data on its own, circles abnormal samples, and finally produces a structured report that can be retained and exported.
🗺️ AI Capability Map
The platform's AI capabilities are spread across two entry points: the blue "AI Analysis" group in the top toolbar, and the green "Scenario" group.
| Capability | Entry Point | What It Does | Prerequisite |
|---|---|---|---|
| AI Auto Modeling | Create Instance → AI Build | Read Excel, identify data structure, create an instance and configure a model, run the fitting | LLM configuration only |
| AI Analysis Chart Creation | AI Analysis → First item | After understanding the business, automatically plan and generate a set of analysis charts | Fitted model + LLM configuration |
| AI Cleaning | AI Analysis → Second item | Analyze metrics → generate charts → automatically circle abnormal samples and diagnose | Fitted model + LLM configuration |
| AI Existing Chart Analysis | AI Analysis → Third item | Interpret the charts already placed on your current canvas one by one | Fitted model + LLM configuration |
| AI Comparative Analysis | AI Analysis → Fourth item | Compare the red and blue sample groups and find the differing variables and their causes | Red and blue groups already circled |
| Scenario Analysis | Scenario → First item | Generate a scenario scoring table + data collection template | LLM configuration only |
| Configuration Diagram Analysis | Scenario → Second item | Upload a configuration diagram screenshot, identify the parameters in it → generate a parameter table | LLM configuration only (multimodal) |
| Analysis Report Retention | Last item of both entry points | View, reuse, export, and delete historical reports | — |
💡 AI Auto Modeling and Scenario / Configuration Diagram Analysis are independent entry points that do not depend on an existing model; the remaining four all require a model that is already activated and fitted (Fit) in the model list on the right.
1️⃣ Preparatory Step: Configure the Large Language Model (LLM)
All AI features share the same large language model configuration. Click the Settings ⚙️ button in the top toolbar and select LLM Configuration on the left.
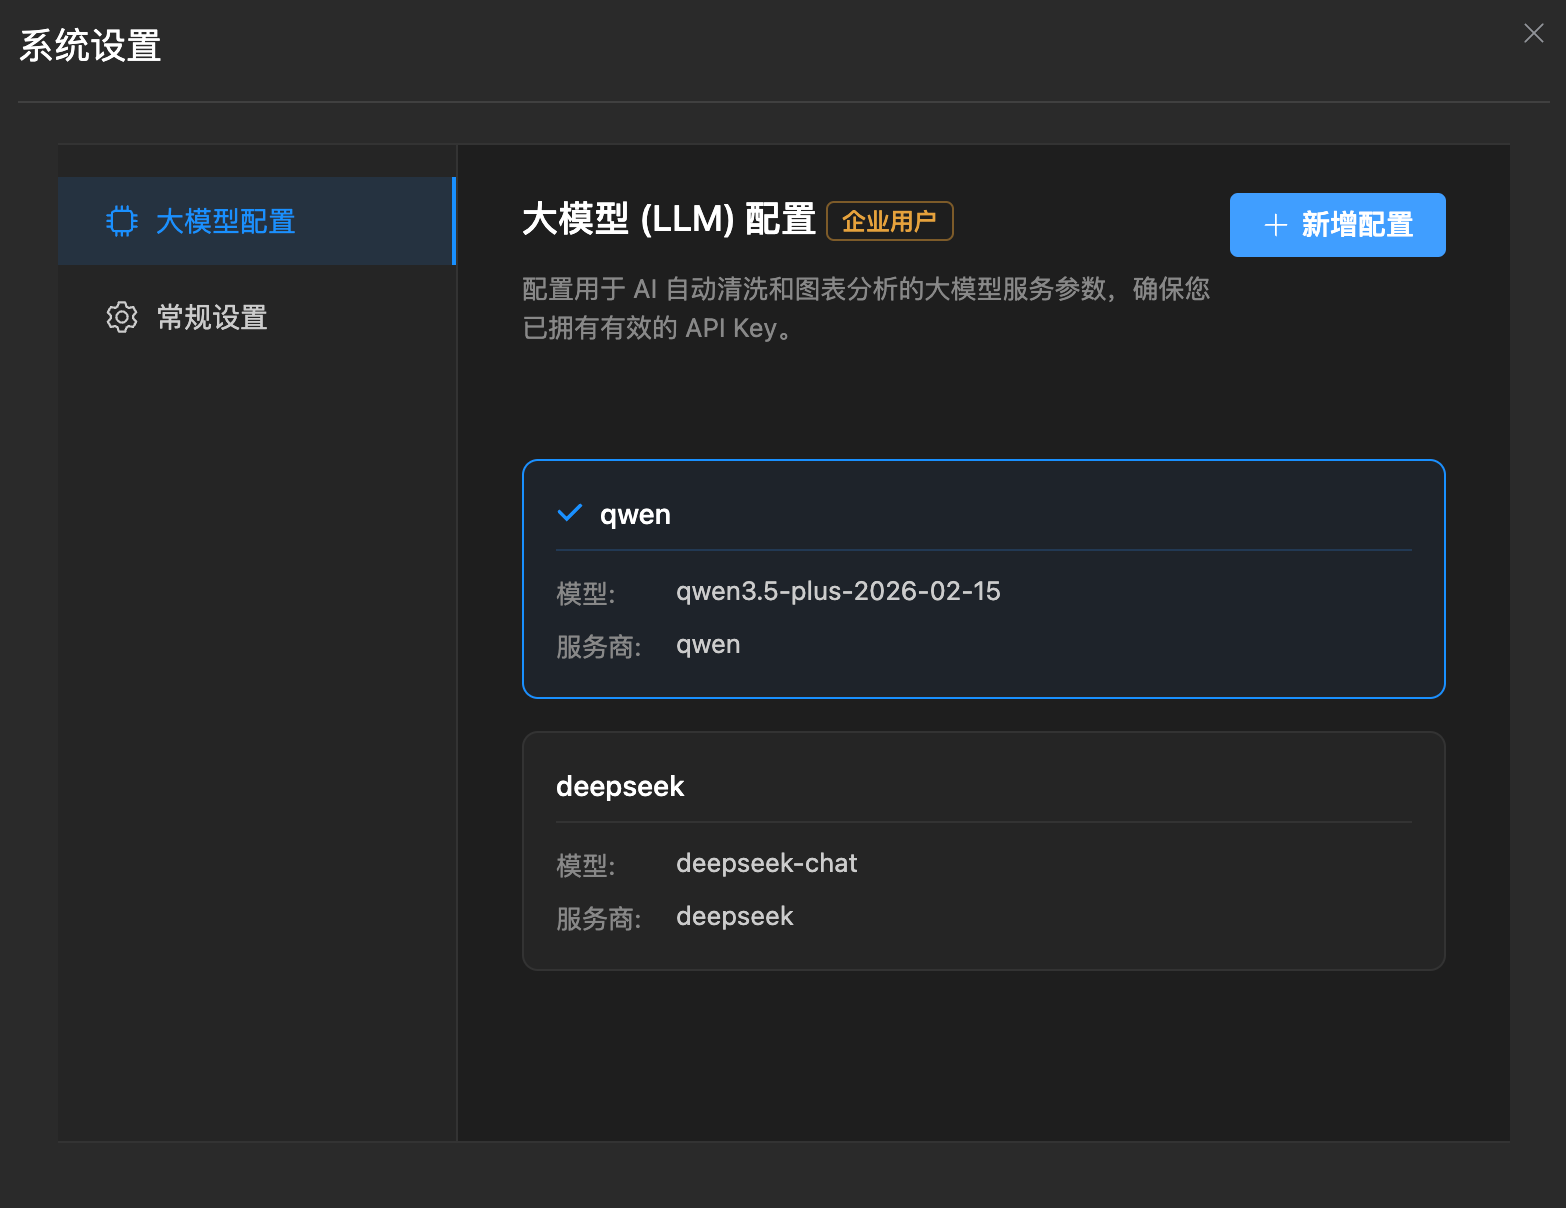
Configuration Fields
| Field | Description |
|---|---|
| Configuration Name | An alias for easy identification, for example "My Qwen Configuration" |
| Service Provider | Common providers are preset; you can also choose Custom (OpenAI-compatible) to connect a private deployment |
| Base URL | The provider's API address (required in custom mode) |
| API Key | Your key |
| Model Name | For example qwen-max, deepseek-chat, gpt-4o |
Key Tips
- Multiple configurations can coexist: You can save configurations for several providers at the same time and switch at any time; the system always keeps at least one configuration.
- Prefer multimodal models: Configuration Diagram Analysis requires the model to have image-reading capability, and a text-only model cannot handle it.
- Data does not leave the intranet: The platform itself runs completely offline, and only when you actively click an AI feature will data be sent to the API address you configured yourself. Configure a custom Base URL to connect to a large language model deployed privately inside your enterprise.
⚠️ Three reminders about cloud agents (also shown inside the platform):
- Watch the token consumption——long reports and multi-chart analysis consume a considerable amount of quota;
- Models have context limits——when the data volume is too large, a complete analysis is not possible and the platform truncates automatically;
- Large models hallucinate——be sure to judge whether the conclusions are right or wrong in light of your own business, and do not take the AI output directly as a conclusion.
2️⃣ AI Auto Modeling
Entry: Top toolbar → Add Instance → switch to the AI Build tab → click "Start AI Build".
This is the zero-configuration modeling path offered by the platform: you only need to drag your Excel in, and the AI automatically completes data structure identification and model configuration.
Four-step flow:
- Parse the file locally and extract data features —— Read the Excel locally and extract the first several rows as a preview (this step is offline)
- The AI identifies the data structure and generates project information and model configuration —— Identify the title row, name row, observation column, X columns, and Y column, and automatically come up with an instance name
- Create the instance and save the model configuration —— Automatically create the instance and the model
- Train the model and generate report charts —— Automatically select the number of components through cross-validation and lay the common charts onto the canvas
For details, see: AI Auto Modeling
3️⃣ AI Analysis Chart Creation
Entry: AI Analysis → AI Analysis Chart Creation
Unlike "AI Cleaning", this item does not change data and does not look for anomalies; it does just one thing: decide which charts should be viewed according to your business description, and draw them directly.
- The AI first analyzes the current model type and metrics to judge which views are suitable (for example, for an OPLS-DA model it gives priority to S-Plot and the confusion matrix)
- It then creates charts in batch and arranges them automatically on the central canvas
- Progress is displayed along the way:
Analyzing the model and deciding which charts to create...→Planning to create N charts, generating the canvas...
💡 When to use it: You have just taken over a model and are not sure where to start. Let the AI lay out a first version of the charts, and then go deeper based on the actual figures.
4️⃣ AI Cleaning
Entry: AI Analysis → AI Cleaning (magic wand icon)
This is the platform's flagship AI feature: it automates the entire chain of "look at the metrics → draw charts → find anomalies → give suggestions".
The Three Steps It Performs Automatically
| Step | What the AI Is Doing |
|---|---|
| ① Analyze model metrics | Read R²X, R²Y, Q²Y, the number of components, etc., and judge the health of the model |
| ② Generate multi-dimensional charts | Independently plan and draw the charts needed for auxiliary analysis (T², SPE, score plots…) |
| ③ Diagnose abnormal data | Locate over-limit samples, automatically highlight and circle them in red, and give the reason for each |
Output
The cleaning diagnosis report generated by the AI contains:
- Abnormal data found:
The system has automatically highlighted and circled the following abnormal samples in red: <row number list> - Comprehensive analysis of the causes of anomalies: Infer the business-level root cause in light of the data features
- Clear operational suggestions: For example, pointing out that a sample may have "a serious measurement error in a key chemical indicator" or "a wrong numerical unit (such as recording mg/L as g/L)"
💡 Abnormal points are automatically applied to the canvas: After the report is generated, the circled abnormal samples are highlighted on the charts at the same time, so you can view their positions directly in the charts and then decide whether to remove them.
Scenario Description Before You Start
After clicking AI Cleaning, a scenario description dialog pops up first:
| Option | Description |
|---|---|
| Document generation language | Chinese / English |
| Business scenario description | Optional. Describe the industry, process, and known issues; the more detailed it is, the more relevant the conclusions will be |
💡 For example, if you enter "baijiu brewing, concerned about fermentation batch consistency, known equipment overhaul in March", the AI's diagnosis will be noticeably more relevant to the business.
5️⃣ AI Existing Chart Analysis
Entry: AI Analysis → Existing Chart Analysis
The difference from AI Cleaning is: AI Cleaning lets the AI decide which charts to draw, whereas this feature has the AI interpret the charts you have already laid out.
The Three Steps It Performs Automatically
- Analyze model metrics
- Analyze the current charts —— Read the charts on the canvas one by one (
Analyzing chart N/M...) - Diagnose abnormal data
The Unique "Analysis Perspective" Option
This feature has one extra Analysis Perspective dropdown in the scenario description dialog:
| Perspective | How the AI Expresses Itself |
|---|---|
| Data Analyst | Focuses on interpretation of statistical metrics, model diagnosis, and methodological suggestions |
| Business Expert | Focuses on business meaning, process impact, and directly actionable operational suggestions |
💡 Choose "Business Expert" before a briefing, and the wording you get is easier to present directly to non-technical colleagues.
6️⃣ AI Comparative Analysis
Entry: AI Analysis → AI Comparative Analysis
It is used to answer a very specific kind of question: "Where exactly do these two groups of samples differ?"
Prerequisite: First Circle the Red and Blue Groups
You must first use the lasso to circle two groups of data in a scatter chart (such as a t1-t2 relationship plot) or a table:
- First group → automatically marked as red
- Second group → automatically marked as blue
You can also use Shift + click and Ctrl + click in a chart or table to select the red group and the blue group respectively.
The Three Steps It Performs Automatically
| Step | What the AI Is Doing |
|---|---|
| ① Difference metric analysis | Analyze the magnitude of the difference between the red and blue groups on each variable |
| ② Abnormal data comparison | Locate the samples and variables that actually cause the difference between the two groups |
| ③ Generate comparison report | Output structured comparison conclusions and business explanations |
Typical Uses
- Normal batches vs. abnormal batches: Find the deviating variables of the abnormal batches
- Different formulas / different raw materials: Locate the key factors causing the quality difference
- Before-and-after improvement comparison: Verify whether the process adjustment really worked
7️⃣ Scenario Analysis and Configuration Diagram Analysis
These two items are independent of any specific model and serve the work before modeling——they help you think clearly about "whether to model at all and which data to collect".
Scenario Analysis
Describe your industry, equipment, and process, and the AI outputs:
- A scenario priority scoring table (business value × data availability)
- A set of data collection templates (clearly listing which X and which Y to collect)
After the analysis is complete, you can directly Export Markdown or Download Excel (multiple worksheets).
Configuration Diagram Analysis
Upload a configuration diagram / HMI screenshot, and the AI uses its multimodal image-reading capability to identify the parameters in the image and outputs an in-image parameter table and a data template Excel.
💡 This is a great tool for quickly turning "the variable list in a veteran engineer's head" into a table——take one screenshot of a DCS screen and you get a list of point parameters waiting to be confirmed.
For details, see: Scenario Analysis and Configuration Diagram Analysis
8️⃣ Analysis Report Retention and Traceability
Every AI diagnosis automatically generates and retains a structured report, which you can consult, reuse, and export at any time.
Two Report Entry Points
| Entry | Reports Stored |
|---|---|
| AI Analysis → Analysis Report | AI cleaning diagnosis reports, AI comparative analysis reports, AI chart analysis reports |
| Scenario → Analysis Report History | Scenario analysis reports, configuration diagram analysis reports |
What the Report List Can Do
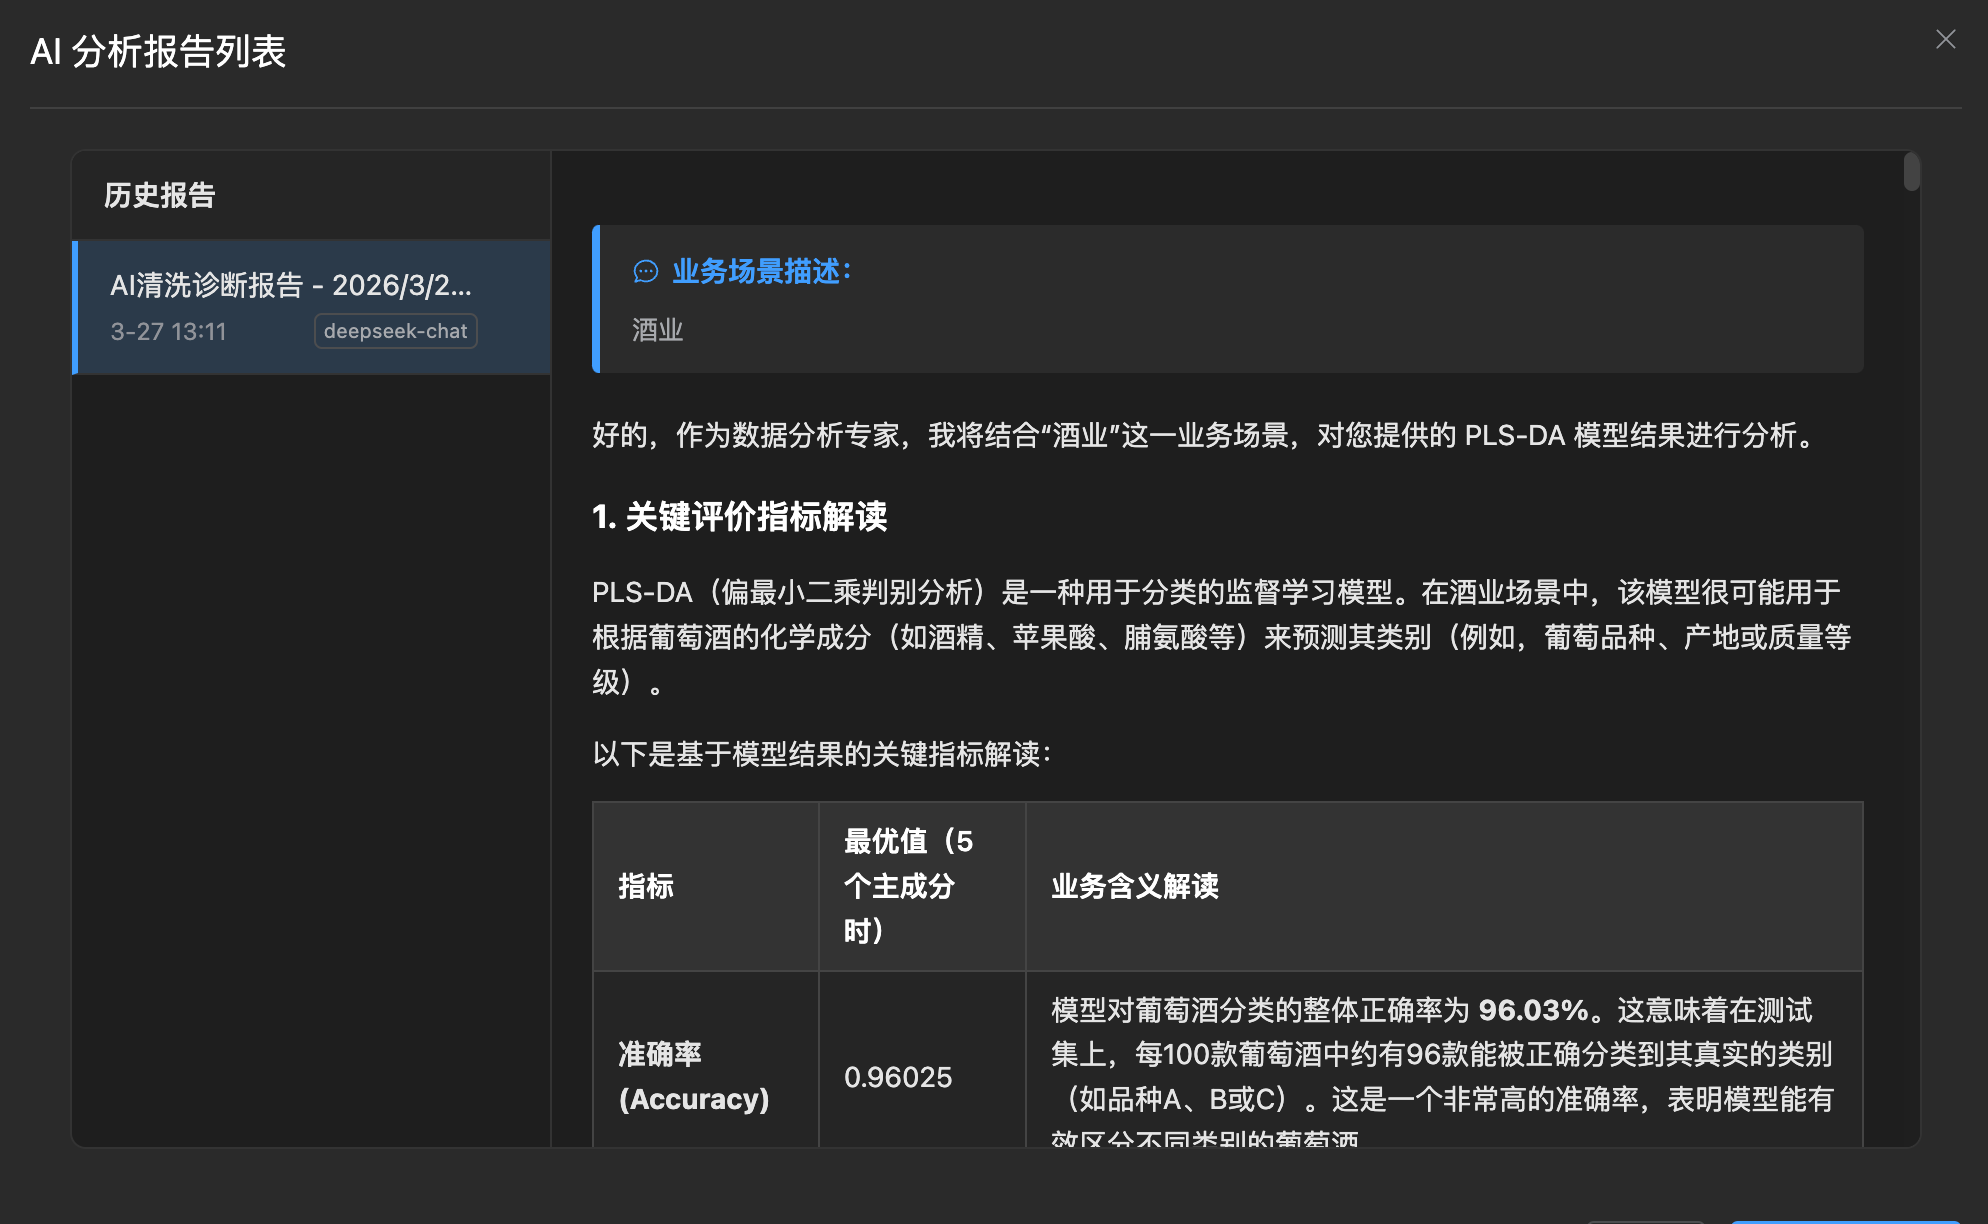
- Historical traceability: Records the report generation time and the underlying large language model used
- Review the context: View the business scenario description filled in at the time
- Reuse abnormal point selections: Click Apply Abnormal Selections to reapply the abnormal samples recorded in the report (including the red group/blue group) to the current canvas
- Export: AI reports support Export Markdown and Export Word; scenario / configuration diagram reports additionally support Download Excel
- Delete: Clean up historical reports you no longer need
💡 "Apply Abnormal Selections" is an easily overlooked but practical feature: after switching to another model or restarting the software, you can restore the judgments you made back then to the canvas from an old report with one click.
🧩 Suggested Combinations
Scenario A: A newcomer quickly getting started with an unfamiliar dataset
AI Auto Modeling → AI Analysis Chart Creation (lay out a first version of the charts) → AI Existing Chart Analysis → Manually confirm anomalies → Delete data → Fit againScenario B: Routine batch anomaly troubleshooting
Open the model → AI Cleaning (automatically circle anomalies + produce a report) → Check the abnormal samples in the report → Delete data → Fit again → Look at Q²Y againScenario C: Reporting to management
Circle the red and blue groups → AI Comparative Analysis (choose "Business Expert" as the analysis perspective) → Export Word → Add to the briefing materialsScenario D: Which data a new production line should collect
Scenario Analysis (generate a data template) → Configuration Diagram Analysis (take a DCS screenshot to verify the points) → Collect according to the template → Formal modeling⚠️ Usage Boundaries
- AI does not replace statistical judgment: For conclusions in the report such as correlation coefficients or whether the model is overfitted, the model metrics should still be the standard
- AI deletion suggestions need human confirmation: The platform never deletes any data automatically; every removal action is executed after your confirmation
- token and context costs: The more charts there are and the larger the data, the higher the consumption; it is recommended to narrow down to the key charts before analyzing
- Offline first: When the AI features are not in use, the platform runs completely offline and makes no external requests