Step 3: Modeling Analysis
Configuration is complete, now it's time to witness the miracle - modeling!
🤖 Automatic Algorithm Matching
You don't need to know when to use PCA and when to use PLS. The platform will automatically switch based on your data configuration:
- Only X columns? -> PCA (Exploration Mode): Help you see what the data looks like and if there's any clustering.
- Have X and Y columns? -> PLS (Prediction Mode): Establish the relationship between X and Y for prediction.
Click fit! Find the best principal components through cross-validation

🎛️ Adjusting Parameters is Like Adjusting Volume

Parameters are crucial for model performance. The most important parameter is Components, also called "latent variables".
- C+1 / C-1 buttons:
- Click C+1 to add a component, making the model more complex with better fitting but possible overfitting.
- Click C-1 to reduce a component, making the model simpler with stronger generalization ability.
📊 Understand the Health Check Report
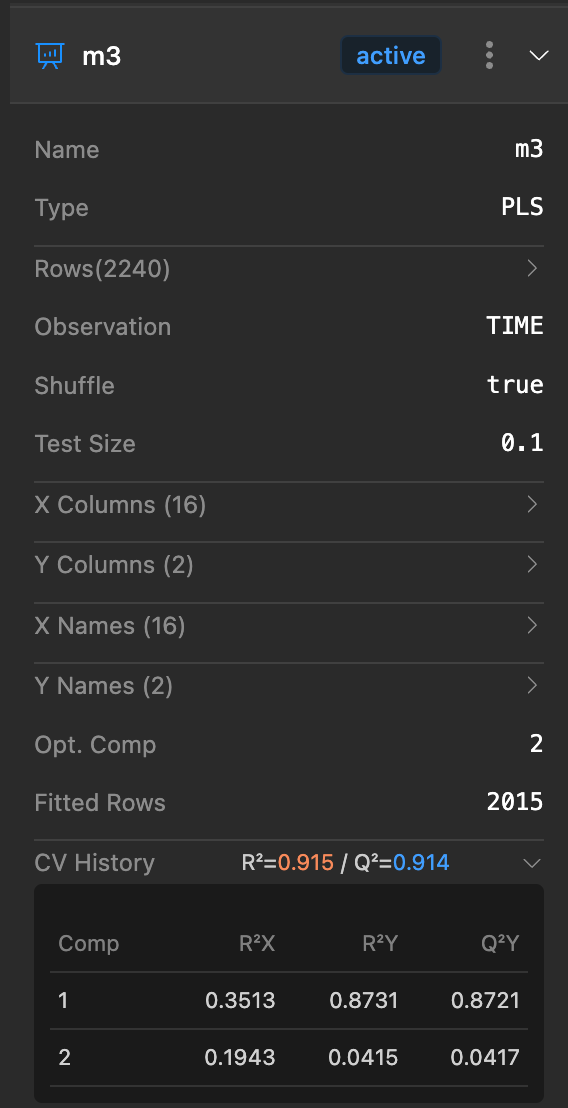
After each model update (such as deleting abnormal data, adjusting components with C+1/C-1), the system will automatically recalculate. You just need to click to expand the model details to see the latest "health check report":
- R2X (Independent Variable Explanation Rate): How much information of X data (features) the model explains.
- R2Y (Dependent Variable Explanation Rate): How much information of Y data (results) the model explains. Higher is better, for example 0.9 is great!
- Q2Y (Predictive Ability): The most critical indicator! Represents how accurate the model is for unknown data. If R2Y is high but Q2Y is low, it's "memorizing by rote" (overfitting), you need to reduce components.
- RMSE (Error): Lower is better, representing the average gap between predicted values and actual values.